Marketing agency reports: 7 questions when green arrows lie


Gabriel Espinheira
Your agency report is green, polished, and on time. Your inbox is still quiet. That is the problem with most marketing agency reports: they can make activity look healthy while the business stays exactly where it was last month. A good report does something harder. It proves what shipped, what changed, why it changed, and what happens next. If your report cannot do that in plain English, the green arrows are not evidence yet. They are decoration.
TL;DR: Marketing agency reports should prove what shipped, what changed, why it changed, and what happens next. Green charts only matter when they connect to agreed targets, source data, lead quality, and a decision. Use seven questions to turn each report from performance theatre into an accountability document.
What should marketing agency reports prove?
Marketing agency reports should prove four things: the work done, the metric it was meant to move, the quality of the result, and the next decision. If one of those is missing, you are reading activity, not accountability.
That distinction matters because founders do not hire an agency to receive a PDF. They hire one to create movement: more qualified enquiries, cleaner tracking, sharper ads, better pages, stronger content, faster decisions. The report is only useful when it helps you decide whether that movement is happening.
Most weak reports fail in the same way. They lead with impressions, clicks, sessions, reach, or engagement because those numbers are easy to collect and easy to make look good. Sometimes they matter. Often they are only the top of the chain.
Google Ads defines a conversion action as a customer activity that is valuable to the business, such as a purchase, sign-up, or call. That is the frame to bring to every agency report: what action was valuable, where did it happen, and did the agency's work move it?
The deeper problem is not a lack of data. It is too much data with too little interpretation. Supermetrics' 2025 marketing data report says marketers are using 230% more data than in 2020, while 56% say they do not have enough time to analyse it thoroughly. More charts will not fix that. Better questions will.
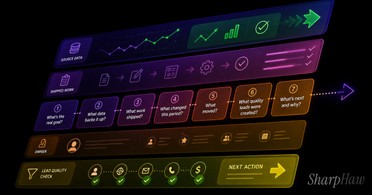
Start with these seven.
Question 1: What work actually shipped?
A useful report starts with shipped work, not abstract effort. You should be able to point to the page, ad, email, article, tracking fix, campaign change, audit, or experiment that went live.
If the report says "optimised campaigns," ask what changed. Which audience was paused? Which creative was tested? Which landing page was edited? Which keyword was removed? Which conversion event was repaired?
The answer should not be a paragraph of fog. It should be a short inventory with links.
For example:
Landing page headline changed from X to Y.
Meta ad set paused because cost per qualified lead crossed the agreed threshold.
Google Ads search term exclusions added after irrelevant spend was found.
Blog post published with target query, internal links, and tracking.
GA4 key event checked against the form submission path.
That list does two things. First, it proves work happened. Second, it gives you something to inspect. You are no longer debating whether the agency was "busy." You are looking at the actual work.
This is where many marketing agency reports go soft. They confuse effort with output. Hours were spent. Calls happened. Dashboards were checked. But nothing durable shipped.
SharpHaw's operating bias is different: weekly work should leave a trail. In SharpOS, the Board shows what moved, Pages show the thinking, Audits show the checks, Analytics shows the numbers, and Media Center keeps the assets in one place. The point is not another tool. The point is evidence.
If the work cannot be named, linked, or inspected, do not let the report move on to the graph.
Question 2: Which business metric moved?
A green arrow only matters when it sits beside the business metric you agreed to improve. If the goal was qualified enquiries, a rise in impressions is context. It is not the win.
This is the question that separates a real report from performance theatre:
What number did this work move that the business actually cares about?
For a service business, that may be qualified enquiries, booked calls, cost per qualified lead, lead-to-call rate, proposal requests, or pipeline value. For ecommerce, it may be conversion rate, revenue, average order value, repeat purchase rate, or contribution margin. For content, it may be qualified organic entrances, assisted enquiries, rankings for commercial terms, or sourced citations.
The exact metric depends on the channel. AgencyAnalytics' reporting examples separate PPC, SEO, Google Ads, ecommerce, email, and social reports because each channel needs different KPIs. That part is fair. The trap is when the agency reports the channel metric and stops before the business metric.
Clicks can rise while enquiries fall. Reach can rise while lead quality drops. Cost per lead can improve because the campaign is attracting cheaper, worse leads. ROAS can look healthy while the sales team rejects half the pipeline. None of those are edge cases. They are normal reporting failures.
So ask for the chain.
Traffic turned into what? Clicks turned into what? Leads turned into what? Content turned into what? Spend turned into what?
If the answer is "we need more time," that may be true. Some channels compound slowly. But the report should still show the leading indicator, the lagging indicator, and the reason the agency believes the leading indicator is worth trusting.
Green is not enough. Green beside the right number is the start.
Question 3: Can I see the source data?
You should have access to the accounts and raw sources behind your agency report. A dashboard screenshot is not a substitute for account ownership, especially when ads, analytics, forms, and CRM data decide whether the report is true.
This is not about paranoia. It is about control. If the agency owns the ad account, filters the dashboard, and sends you a PDF, you are not reading your data. You are reading their presentation of your data.
At minimum, you should know where each number came from:
Google Ads account
Meta Business Manager
GA4 property
Search Console
CRM or lead sheet
Call tracking
Email platform
workspace record of the actual work
Then check whether the date ranges match. A classic weak-report move is comparing one metric week-on-week, another month-on-month, and a third against a different attribution window. The charts look coherent. The logic is not.
This is also where European founders need to be careful with consent, privacy, and third-party data access. Google Ads' own conversion documentation notes that advertisers need proper user information and consent where required by law. Your report should not hide the measurement setup. It should explain it.
A good agency will not be offended by this question. They will have the answer ready. They will show you the source, the filters, the attribution window, and the known limitations.
A weak agency will tell you the dashboard is "too technical" or that they will "summarise everything for you." That may sound helpful. It can also be a way to keep you dependent.
Ask for source access early. It gets harder later.
Question 4: Are the leads any good?
Lead volume is not lead quality. A report that shows more leads but says nothing about fit, speed, qualification, and sales outcome is only half a report.
This is where marketing reporting often breaks. The agency can see the click and the form fill. The founder sees the actual enquiry: wrong country, no budget, student research, spam, existing customer, competitor, supplier, or someone who wanted a service you do not sell.
If nobody joins those two views, the report will reward the wrong campaign.
The data problem is real. Integrate and Demand Metric's 2025 research reported that nearly 75% of respondents estimated at least 10% of their lead data was inaccurate, outdated, or non-compliant, and more than 60% said poor data disrupted lead handoffs and slowed sales productivity. That means report quality is not just a marketing issue. It is an operations issue.
So ask:
Which leads were accepted as real opportunities?
Which leads were rejected, and why?
Which channel produced leads that sales actually wanted?
How fast did we respond to new enquiries?
Which forms, calls, or booking paths produced junk?
What are we changing because of lead quality, not just lead count?
That last question is the one to watch. If the agency keeps celebrating lead volume after you explain that the leads are weak, the report is protecting the campaign instead of protecting the business.
For paid search and paid social, this should feed directly into account changes: negative keywords, audience exclusions, creative changes, landing page edits, CRM imports, and conversion definitions. For content, it should change the topic map and CTA. For website work, it should change forms, proof, page hierarchy, or offer clarity.
The report should not stop at "leads up." It should tell you whether the right people are raising their hands.
Questions 5-7: What changed, who owns it, and what happens next?
The last three questions turn the report into a management tool: what changed, who owns the next move, and what decision should I make now? Without those answers, the report creates work for you instead of removing it.
Ask question five: what changed since the last report?
Do not accept "performance improved" as the whole answer. You need the driver. Did performance change because the agency changed the work, because the market changed, because spend changed, because tracking changed, or because one outlier day made the graph look better?
Then ask question six: who owns the next action?
A strong report names the owner. Agency. Founder. Developer. Sales team. Content reviewer. No owner means no movement. This is especially important when the next step depends on you. If the agency needs approval, access, product details, or a sales-quality review, the report should say so plainly.
Finally ask question seven: what decision should I make?
Not every report needs a dramatic decision. Some weeks the decision is "keep shipping." But every report should clarify the next move:
Scale this ad set.
Cut this keyword.
Rewrite this page.
Keep the test running another week.
Fix this tracking gap before spending more.
Send three rejected leads back with notes.
Approve the next article.
Stop measuring this metric because it is not changing a decision.
Xtensio's monthly report guidance recommends covering KPIs, work completed, challenges, and next month priorities. That structure is useful because it closes the loop. But the structure alone is not enough. The recommendations need to be specific enough that a founder can say yes, no, or not yet.
This is where many reports quietly fail. They end with "next steps" that are really placeholders: optimise, monitor, improve, continue, review. Those words do not create accountability. They create another month of ambiguity.
The next action should be concrete enough to inspect next week.
How SharpOS changes the reporting loop
SharpOS changes reporting by moving evidence into the weekly workflow instead of burying it in a monthly deck. The report becomes a summary of visible work, not the only place where the work appears.
That matters because the monthly report is late by design. If something broke in week one, you should not learn about it in week four. If a page shipped on Tuesday, you should not need a PDF to prove it exists. If lead quality dropped, the fix should start before the next invoice.
The SharpHaw loop is simple: Plan. Build. Iterate.
Every week should show:
what was planned
what shipped
what changed in the numbers
what blocked progress
what gets shipped next
SharpOS exists to make that visible. Boards show priorities and status. Pages hold briefs and decisions. Audits show findings. Analytics gives the numbers somewhere to live. Studio and Media Center keep creative work connected to the campaign instead of scattered across folders.
The goal is not to drown the founder in a dashboard. It is the opposite. The goal is fewer surprises, fewer mystery numbers, and fewer "what are they doing this month?" moments.
That is also why SharpHaw does not treat reports as a performance costume. Reporting is part of the work, but it is not the work. The work is the shipped page, the cleaner account, the sharper ad, the fixed tracking, the better content brief, the next test, the lead-quality note that changes the campaign.
If your current agency report cannot answer the seven questions above, do not start by asking for a prettier template. Ask for a sharper operating loop.
Frequently asked questions
What should a marketing agency report include?
Marketing agency reports should include shipped work, agreed KPIs, source data, lead quality, interpretation, blockers, owner, and next action. The report should make it clear what changed since the last period and what decision the founder should make now. A dashboard without interpretation is only a data view.
What are vanity metrics in agency reports?
Vanity metrics are numbers that look positive but do not change a decision. Impressions, reach, clicks, followers, and engagement can be useful when tied to funnel movement. They become vanity metrics when the agency reports them without showing qualified enquiries, sales movement, lead quality, or the next action.
How often should a marketing agency send reports?
Monthly reporting is common, but weekly visibility is better for active growth work. A monthly report can summarise progress, but founders should still see what shipped, what changed, and what is blocked during the week. Waiting a month to discover weak tracking or poor lead quality wastes time.
Is a dashboard enough for agency reporting?
A dashboard is enough only when the numbers are simple, source data is accessible, and someone adds interpretation. Most founders need a short written layer beside the dashboard: what changed, why it changed, what matters, and what happens next. Without that, the dashboard makes the founder do the agency's thinking.
How do I know if my agency report is hiding poor performance?
Look for missing links between activity and business outcomes. Red flags include no shipped-work inventory, no source access, no lead-quality review, changing date ranges, unexplained green arrows, vague next steps, and no named owner. The easiest test: ask what decision the report wants you to make.
Your report should make the work easier to judge, not harder. If you need to decode twenty pages of charts to understand whether anything real happened, the agency is putting the burden back on you.
Plan. Build. Iterate.
Ready to see what weekly visibility should look like? Book a 30-min call and we will walk through the loop: what ships, where you see it, and how the numbers connect to the next move.
Read more
UTM naming convention: stop trusting broken campaign data
UTM naming convention guide for founders: fix source, medium, campaign, and CRM handoffs before broken reports steer your spend.
Brand consistency: why your ads and website disagree
Brand consistency fails when ads, website, content, proof, and CTA disagree. Use this founder-ready audit before buying more traffic.
Marketing asset library: stop losing files between vendors
Marketing asset library guide for founders: keep approved files, source assets, versions, permissions, and handoffs clear before vendors change.